


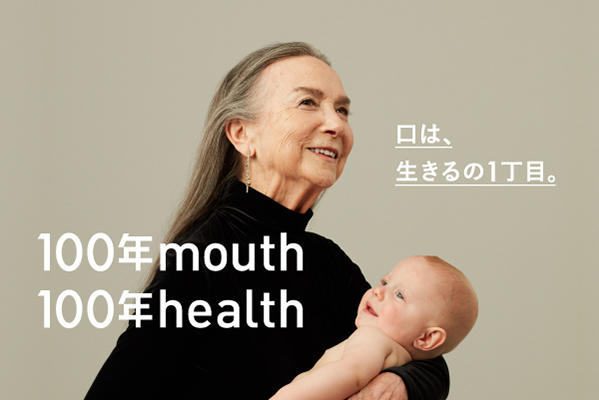
CAMPAIGN・TOPICS
キャンペーン・トピックス

/
PRODUCTS
製品紹介


NEWS
お知らせ
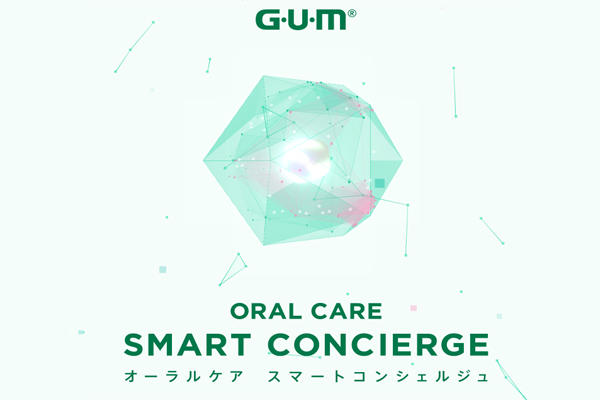
GALLERY
広告ギャラリー

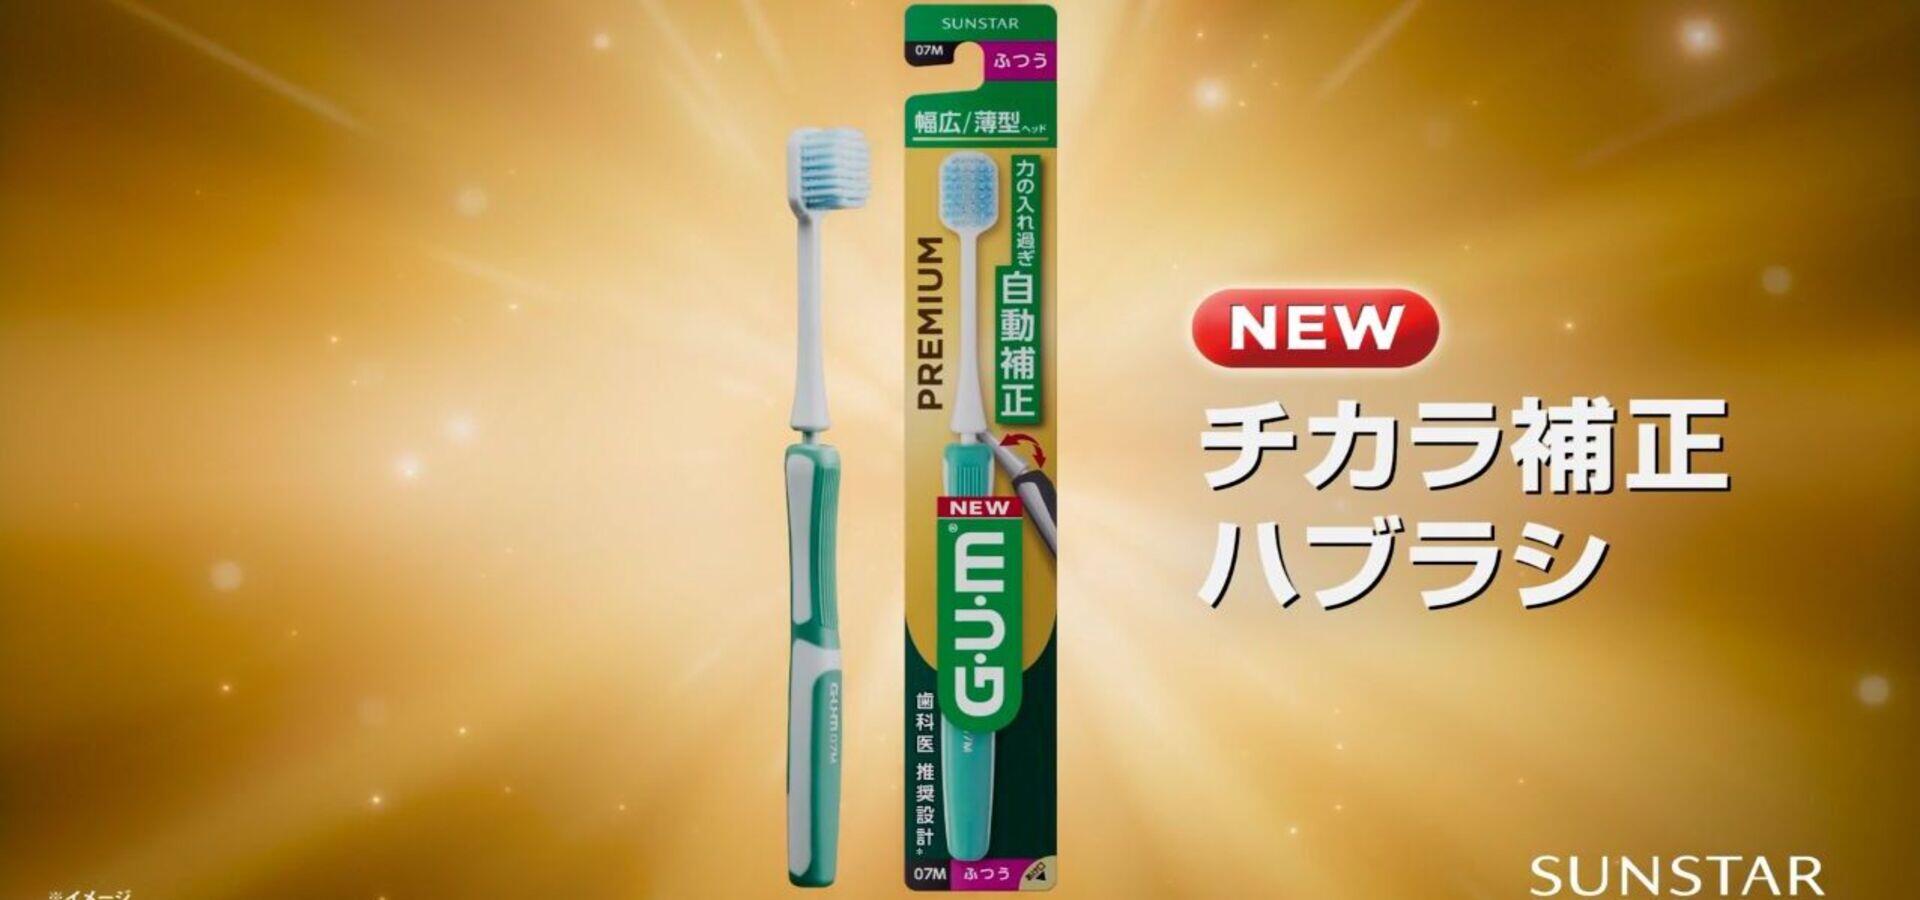
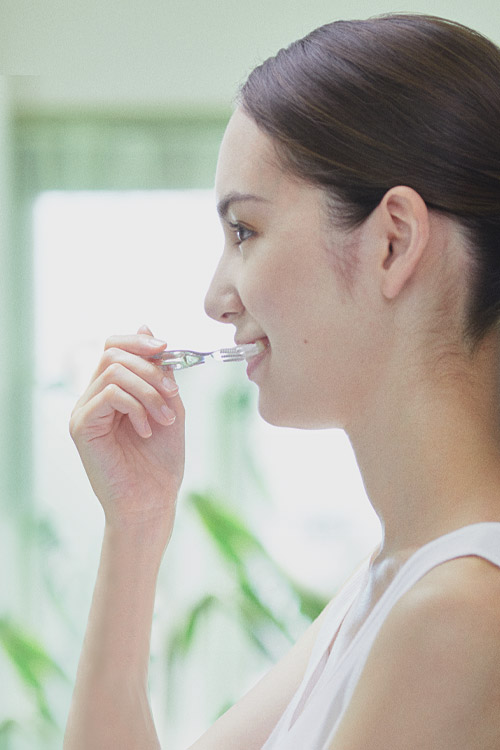
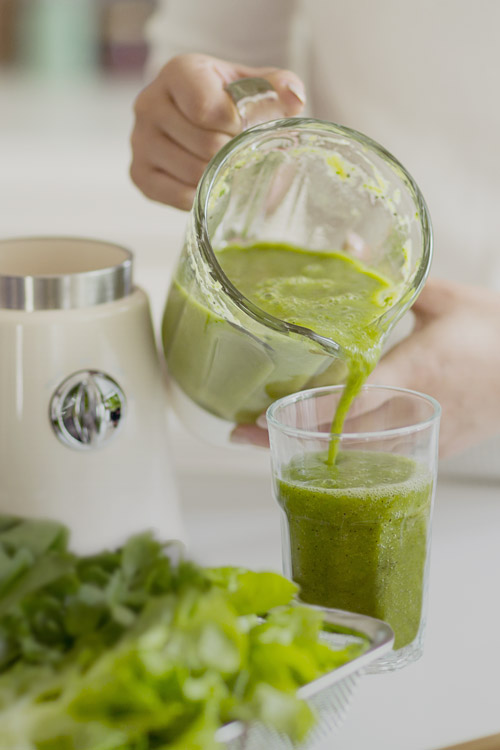
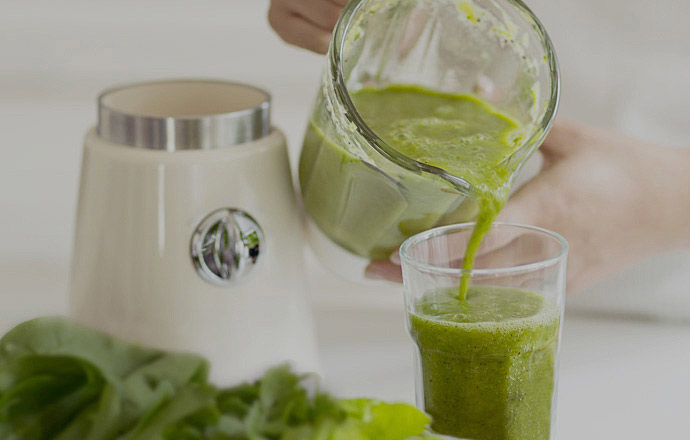
ガム・プレミアム デンタルブラシ 15秒
力の入れ過ぎを自動補正。くびれ部がしなって余分な力を吸収し、適切なブラッシング圧を実現する「チカラ補正ハブラシ」です。
いつも通りのみがき方で、歯科医がすすめる「軽い力でブラッシング」ができ、ハグキにやさしく歯周プラークを除去します。
TV-CM
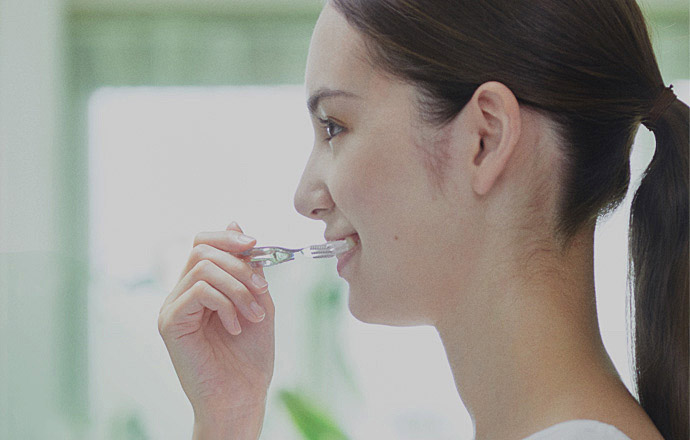
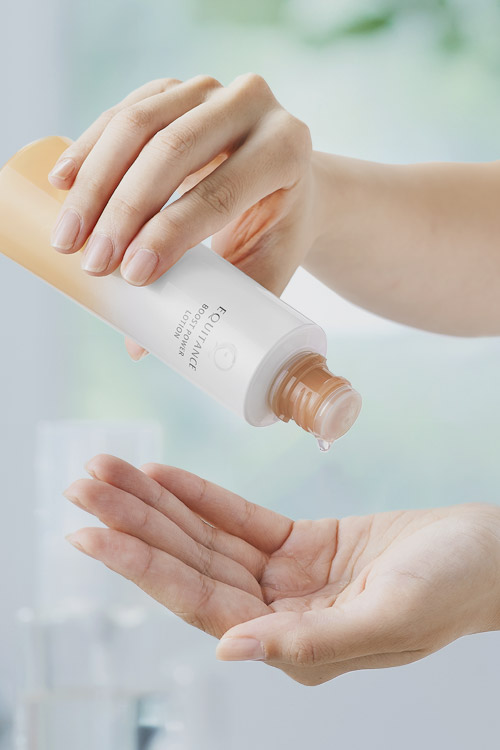
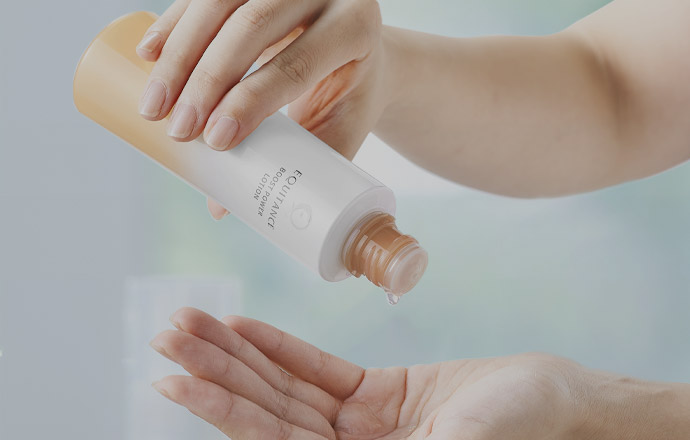
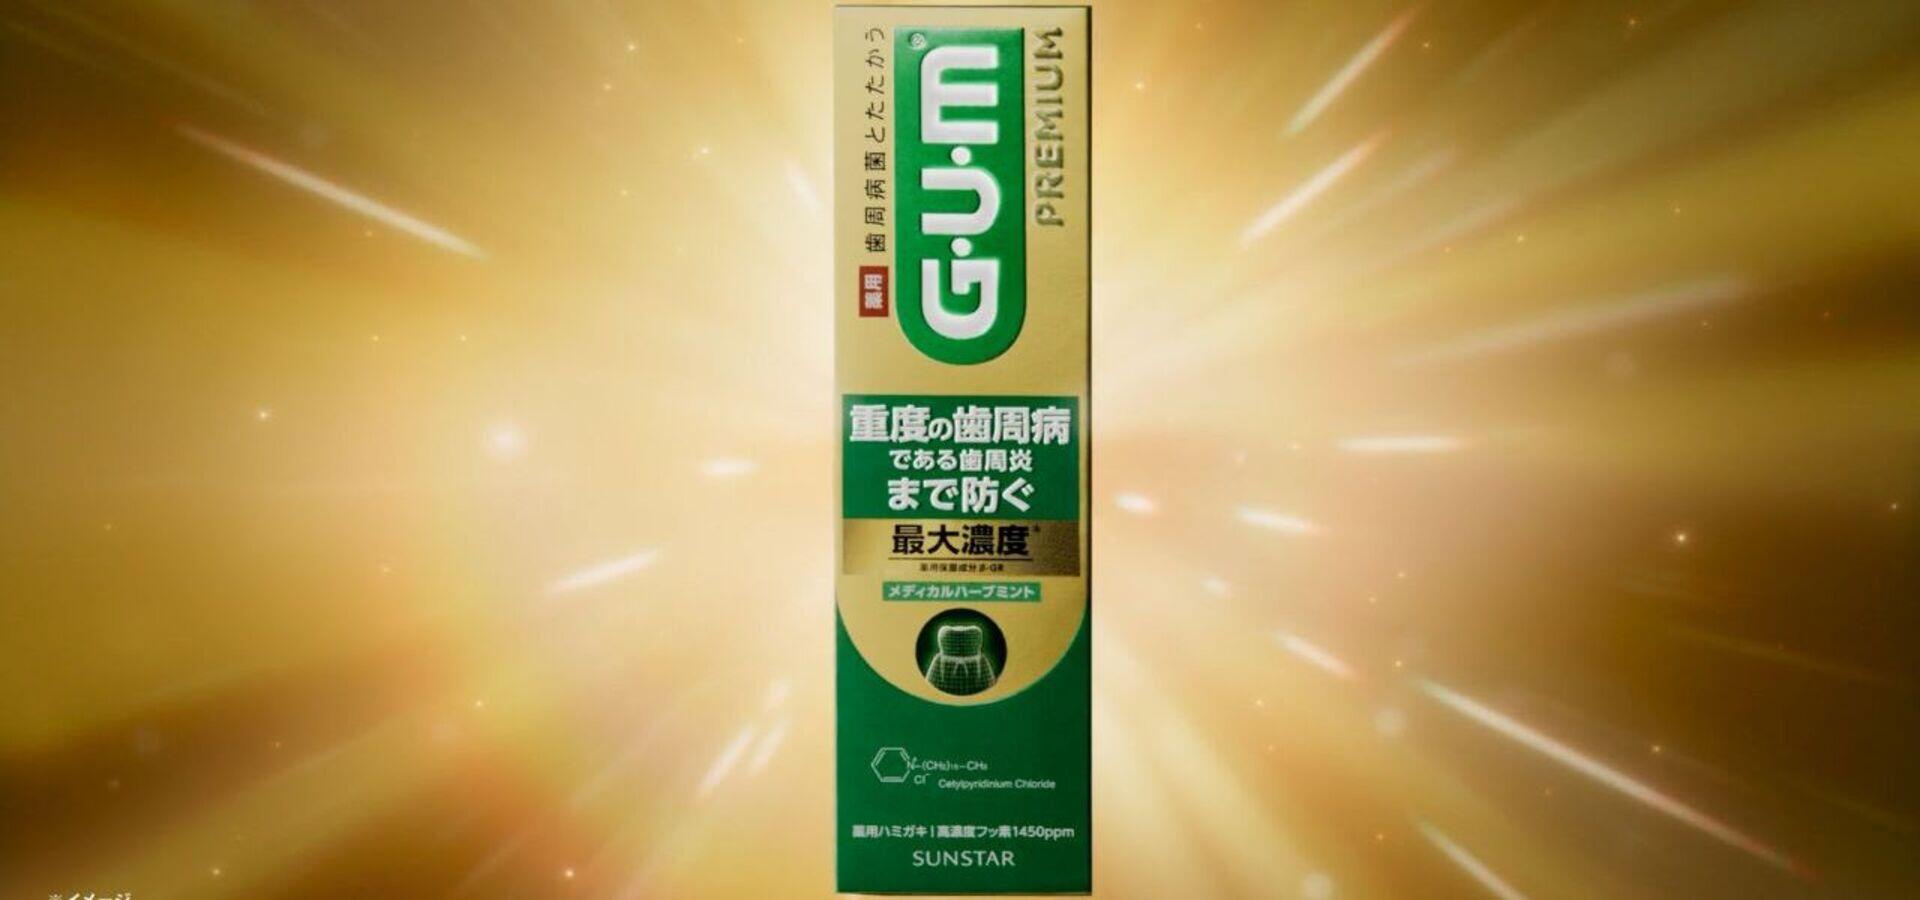
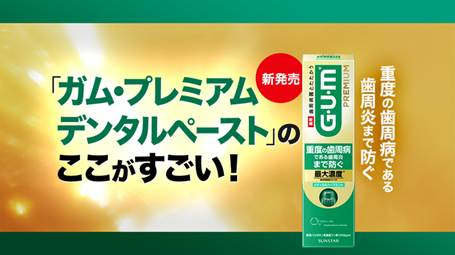
ガム・プレミアム デンタルペースト 30秒
/
RELATED SITES
関連サイト


一般財団法人 サンスター財団
口腔衛生の普及・研究支援、口腔衛生と全身疾患の関わりなどの啓発活動を行っています。
サンスター技研
自動車・建築用の接着剤・シーリング剤、二輪車用の金属加工部品などの製品・サービスを提供しています。
サンスター製品総合カタログ 電子版
最新のサンスター製品総合カタログがご覧いただけます。
※店頭販売している製品を掲載しています。サンスター通信販売取扱品は含まれません。
医療関係者の皆さまへ
医療関係者向けの周術期口腔機能管理に関する情報です。
薬剤師の皆さまへ
『薬剤師向け医・歯・薬連携に関する研修資料』
医・歯・薬の連携に役立つ歯科情報を1テーマ、1ページで簡潔にまとめています。